Hive Analytics X UTurn

How Did I Increase the U-turn Store Checkout Page Conversion Rate by 225%?
Role

Lead UX & CRO

Duration

2 Weeks

YEAR

2020

Imagine you're the founder and CEO of a classic men's wear brand with over 20 stores and a growing reputation for quality. Recently, you launched an online store on WordPress, expecting strong Black Friday sales. Yet, instead of a boost, your sales dropped by 39%, leaving you and your team both surprised and concerned. This was the situation in November 2020 when Hive Analytics, a CRO and media-buying agency, brought me in to find the cause of the sales decline and identify quick solutions.

My role

As the lead UX & CRO Specialist, I collaborated with Hive Analytics to diagnose and resolve a 39% sales drop for a classic men’s wear brand during their Black Friday campaign. My approach included auditing the checkout experience through heatmaps, session recordings, and technical analysis, as well as leading strategic UX improvements to streamline the sales funnel. I identified high-friction areas, prioritized key changes, and presented actionable insights to stakeholders for buy-in and immediate implementation.

Results

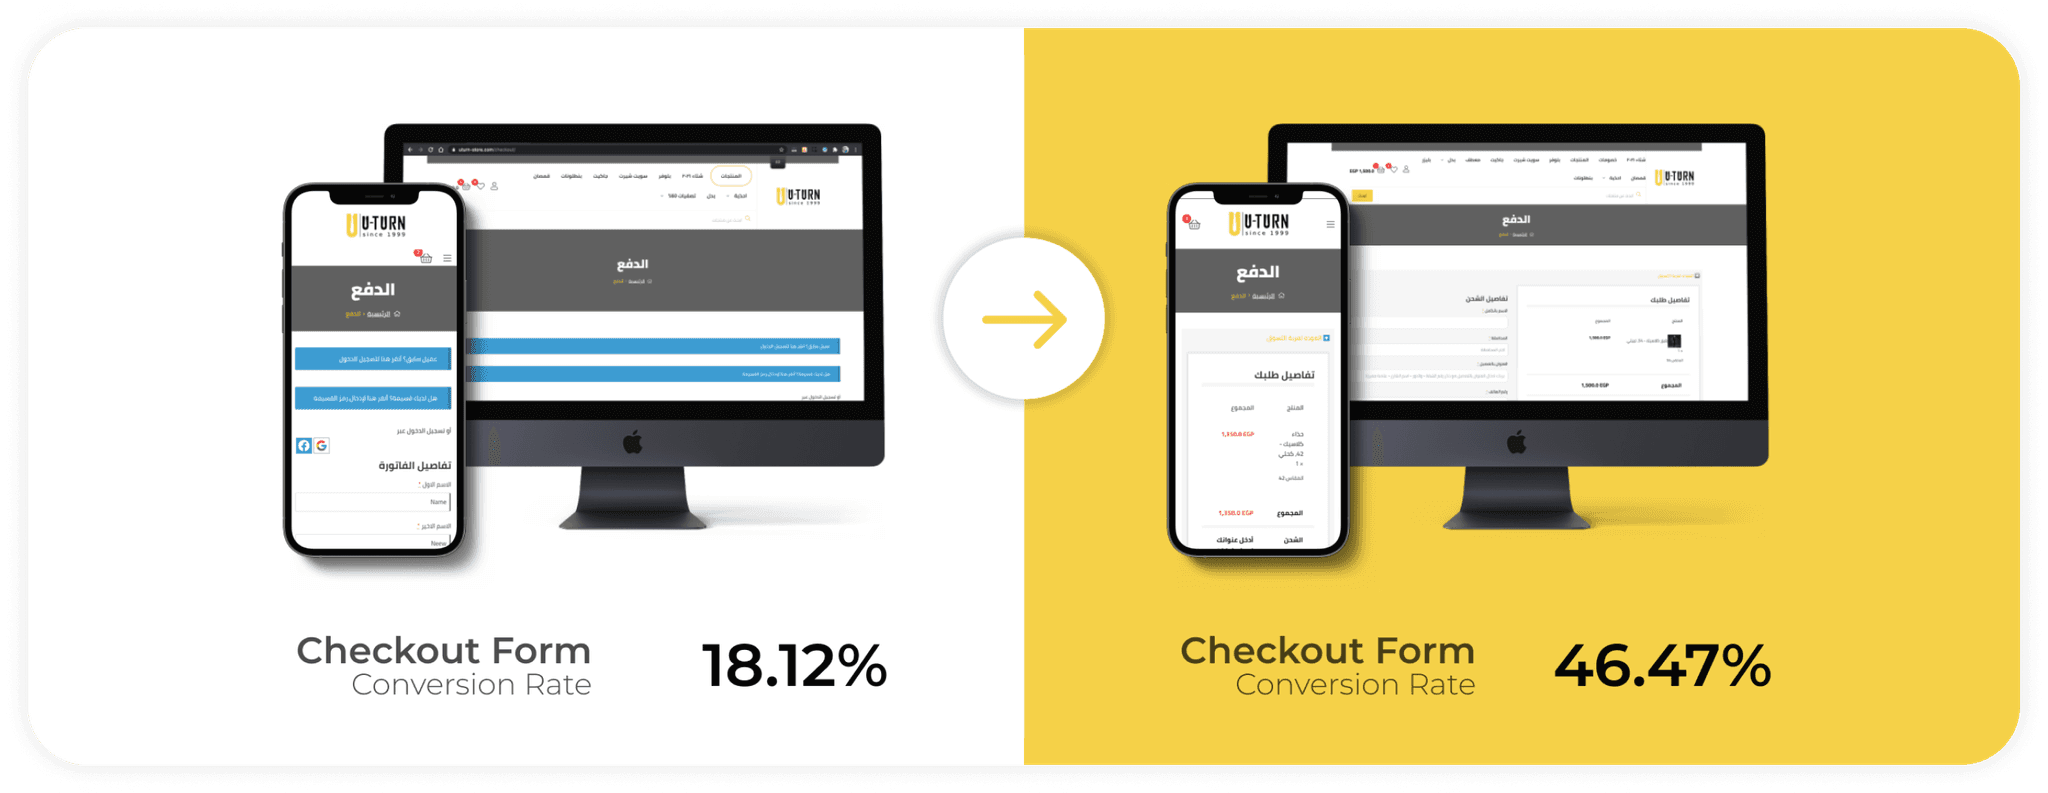
Our targeted enhancements led to a 255% increase in checkout-to-purchase conversion rates within three months. The average form completion time was reduced by 37.2%, showcasing smoother interactions and improved user satisfaction. These outcomes highlighted the effectiveness of UX-focused CRO efforts, leading the client to invest further in UX improvements across the online store and inspiring Hive Analytics to expand their CRO team.

Here’s the Full Story 📖👇

Problem DefinitioN

Analyzing the Sales Funnel

My primary goal was to investigate the causes of this sales drop. Working closely with the media buyer, I analyzed the sales funnel and campaign performance data for November. The analysis revealed the following:

  • Customers initiated checkouts worth EGP 1,700,000, but only EGP 350,000 in sales were completed.

  • The Average Order Value (AOV) was EGP 594.46, yet the conversion rate remained low.

  • Sales funnel metrics: Product Views: 68.1%, Add-to-Cart Rate: 14.3%, Initiated Checkout Rate: 39.4%, Purchase Rate: 18.12%

This showed a significant drop-off from initiated checkouts to completed purchases, suggesting a critical leak at the checkout stage. So, I focused on the checkout page to understand and resolve these issues.

SALES FUNNEL from GA
Discovery

Investigating the Sales Drop

To identify the reasons for the drop, I first connected Hotjar to create heat maps and scroll maps, and began recording user sessions. At the same time, I performed technical, accessibility, and UX audits to uncover further friction points.

My primary goal was to investigate the causes of this sales drop. Working closely with the media buyer, I analyzed the sales funnel and campaign performance data for November. The analysis revealed the following:

  • Customers initiated checkouts worth EGP 1,700,000, but only EGP 350,000 in sales were completed.

  • The Average Order Value (AOV) was EGP 594.46, yet the conversion rate remained low.

  • Sales funnel metrics: Product Views: 68.1%, Add-to-Cart Rate: 14.3%, Initiated Checkout Rate: 39.4%, Purchase Rate: 18.12%

This showed a significant drop-off from initiated checkouts to completed purchases, suggesting a critical leak at the checkout stage. So, I focused on the checkout page to understand and resolve these issues.

Accessibility Audit

I noticed a significant issue with the contrast of the CTA because of the use of white text on yellow backgrounds. The design failed both AA and AAA standards. So, I recommended changing the text color to black.

Technical Audit

I checked the page load speed using both PageSpeed Insights and Google Analytics. The results showed that the page is just 0.86% slower than expected. While this could be improved in the future, it wasn't the main reason for the drop in conversions.

UX Audit

During the UX audit, I identified several issues on the checkout page, which I categorized into:

Severe Issues

  • Entering an address in the city field triggered a request that frequently failed, causing an infinite loading loop.

  • The checkout form and "Place Order" button wasn't visible above the fold on both mobile and desktop.


    Non-Severe Issues

  • Error messages were unclear, making it difficult for users to understand and correct their mistakes.

  • Page contains some elements may led users to unintentionally navigate away from the checkout page.

Heatmaps and Scrollmaps

Based on 100 users' visits, and the findings were:

  • 25% of users left the page before even viewing the checkout form.

  • 55% of users left before they could see the "Confirm Order" button.

  • Users interacted with non-input fields and with elements that led them to navigate outside of the page.

Scroll and Heat MAps

After watching about 30 session recordings, I found two primary issues on desktop and one on mobile.

My primary goal was to investigate the causes of this sales drop. Working closely with the media buyer, I analyzed the sales funnel and campaign performance data for November. The analysis revealed the following:

  • Customers initiated checkouts worth EGP 1,700,000, but only EGP 350,000 in sales were completed.

  • The Average Order Value (AOV) was EGP 594.46, yet the conversion rate remained low.

  • Sales funnel metrics: Product Views: 68.1%, Add-to-Cart Rate: 14.3%, Initiated Checkout Rate: 39.4%, Purchase Rate: 18.12%

This showed a significant drop-off from initiated checkouts to completed purchases, suggesting a critical leak at the checkout stage. So, I focused on the checkout page to understand and resolve these issues.

On mobile, users often began filling out the form but were then distracted by the order details section below. Many scrolled past the "Confirm Order" button, missing it entirely, and continued down to the footer without realizing they hadn’t submitted their order.

On desktop, users had to switch back and forth between the form and order details multiple times. They reviewed details on the left, filled in the form on the right, checked shipping and payment options on the left again, then returned right to complete the form before finally clicking "Confirm Order" on the left.

From these observations, it became clear that the primary friction points were the checkout form visibility and the placement of the "Confirm Order" button. I prioritized addressing these issues over the minor ones since they posed major blockers to conversion.

My primary goal was to investigate the causes of this sales drop. Working closely with the media buyer, I analyzed the sales funnel and campaign performance data for November. The analysis revealed the following:

  • Customers initiated checkouts worth EGP 1,700,000, but only EGP 350,000 in sales were completed.

  • The Average Order Value (AOV) was EGP 594.46, yet the conversion rate remained low.

  • Sales funnel metrics: Product Views: 68.1%, Add-to-Cart Rate: 14.3%, Initiated Checkout Rate: 39.4%, Purchase Rate: 18.12%

This showed a significant drop-off from initiated checkouts to completed purchases, suggesting a critical leak at the checkout stage. So, I focused on the checkout page to understand and resolve these issues.

Solution
Solution

Redesigning the Checkout Page

With a clear understanding of the friction points, I crafted a quick wireframe for a redesigned checkout page. This involved reimagining the page layout, removing any blockers or unnecessary elements, and fixing usability issues to ensure a seamless experience on both mobile and desktop.

Getting Buy-In
Getting Buy-In

Aligning Stakeholders on the Solution

To push forward with the design changes, I presented the research and the proposed design and highlighted specific checkout friction points to demonstrate their impact on conversion rates. One key concern was the "Cash on Delivery" radio button; removing it would disrupt order-tracking functionality at the Wordpress dashboard. So, I suggested to keep the radio button and set it to be pre-checked by default.

Implementation
Implementation

Overcoming Technical Constraints

During the implementation phase, I collaborated closely with 2 word press developers to bring the redesigned checkout page to life. While doing so, we encountered 2 challenges:

Repositioning the "Confirm Order" Button

Moving the "Confirm Order" button required separating it from the order details section which wasn't supported by the current WordPress template. I demonstrated the significance of this change using user session recordings, which persuaded the team to code the checkout page from scratch to achieve the ideal layout.

Pre-Checked COD Radio Button

Setting the "Cash on Delivery" (COD) radio button to be pre-checked introduced a bug that occurred only on desktop for large basket sizes. Since most users accessed the site via mobile, we decided to prioritize the mobile experience and address the desktop bug in a later update.

The pre-checked "Cash on Delivery" radio button unchecks when the page is scrolled up on Desktop.

Google analytics: 94.78% of U-Turn users use mobile devices.


Results
Results

Significant Boost in Conversion Rates

After implementing the improvements on U-turn’s checkout page, we observed:

Checkout-to-purchase conversion rate

A 255% increase in checkout-to-purchase conversion rate within three months, reducing cart abandonment and boosting sales

Form completion time

A 37.2% decrease in form completion time, demonstrating the success of simplifications and enhancements in the checkout process.

These results underscored the importance of UX and CRO efforts, leading Hive Analytics to invest in additional CRO specialists, while the client recognized the value of UX improvements across their online store.

Results

TIT

NEXt Steps
NEXt Steps

Beyond the Fixes

With the checkout improvements in place, my focus shifted to ensuring a seamless, high-conversion experience across the online store. So, I prioritized these:

  • Continue collaborating with developers to resolve production bugs and address any UI/UX debt.

  • Optimize additional stages of the online sales funnel to further boost conversion rates.

  • Assess the feasibility of transitioning to a more robust e-commerce platform, like Shopify, or updating the WooCommerce theme to create a consistent and scalable user experience.

Reflections

What I learned?

Just Enough Research

This project emphasized the importance of efficient, targeted research. Instead of extensive usability testing, I used insights from session recordings to quickly identify actionable issues, balancing speed and effectiveness.

Less Is Often More

Simplifying the checkout process by removing unnecessary steps and improving clarity led to a smoother experience, reducing friction and improving conversions. This reinforced my understanding of how impactful minimal, focused changes can be in UX design.

Thanks for Reading 😊

Reflections

What I learned?